Key Aspects of Quantitative Medication Data in the Community
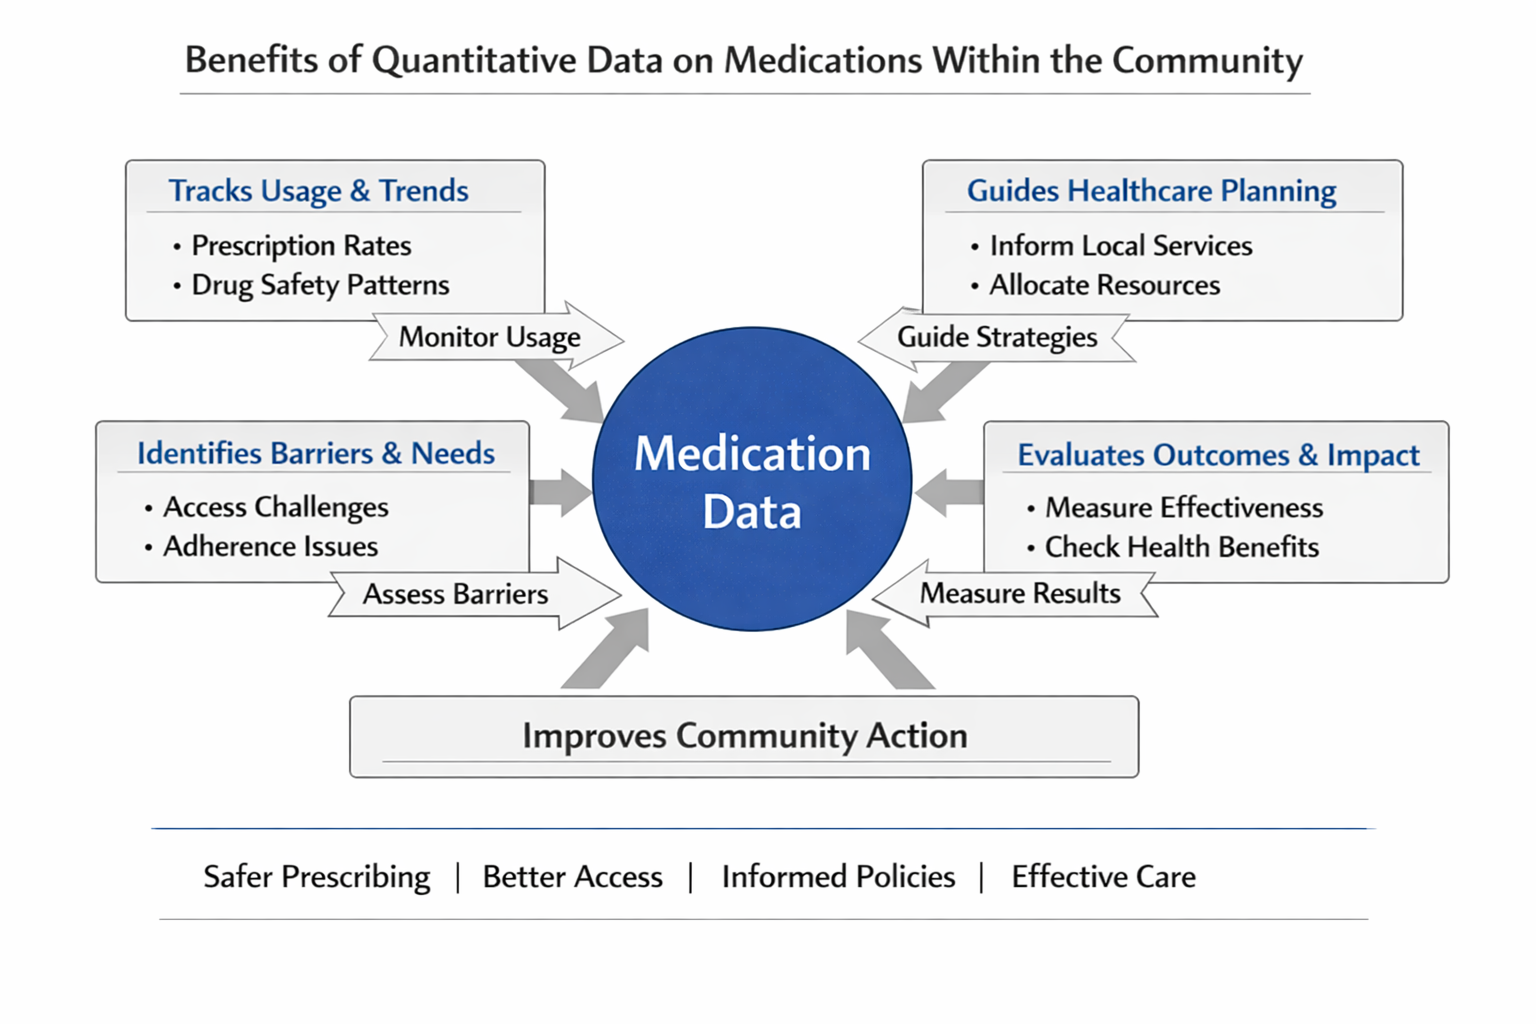
1. Usage & Prescribing Patterns
• Tracks which medications are most commonly prescribed.
• Reveals trends in overprescribing, underuse, or seasonal spikes (e.g. antibiotics in winter).
2. Access & Equity Analysis
• Identifies disparities in medication access across income, ethnicity, or geography.
• Highlights where pharmacies or services are lacking.
3. Effectiveness & Outcomes
• Measures how well medications improve health in real-world settings.
• Links prescriptions to hospital admissions, recovery rates, or chronic condition management.
4. Cost & Resource Allocation
• Quantifies spending on medications by region or condition.
• Helps NHS and councils decide where to invest or cut back.
5. Adherence & Behaviour Insights
• Tracks refill rates and missed doses.
• Informs education campaigns or support services to improve adherence.
6. Service Planning & Evaluation
• Supports decisions on local prescribing guidelines and formularies.
• Evaluates the impact of community pharmacy programs or GP initiatives.
7. Public Engagement & Transparency
• Makes data visible to communities, building trust and accountability.
• Empowers residents to advocate for better access or safer prescribing.